131836
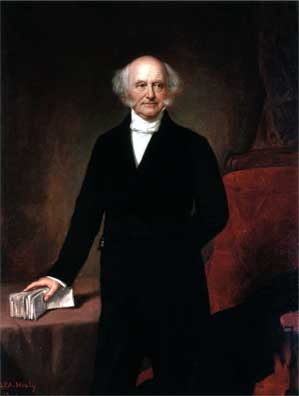
portrait — Martin Van Buren
Presidential Election · 1836
The Election of 1836
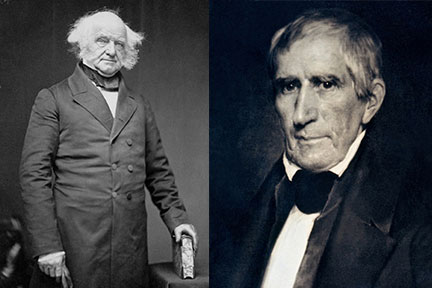
Martin Van Buren defeats William Henry Harrison
Van Buren defeats a divided Whig field to succeed Jackson.
Democratic VictoryMartin Van Buren defeats William Henry Harrison
Van Buren defeats a divided Whig field to succeed Jackson.
Democratic VictoryThe Result


Van Buren defeats a divided Whig field to succeed Jackson.
President Jackson decided not to run for re-election. He called on the Democrats to hold a convention of the people. The convention unanimously selected Martin Van Buren to be the Democratic Presidential nominee, since Van Buren was the hand-picked successor chosen by President Jackson. The Whig party was not strong enough to hold a national convention. As a result, they were not able to nominate one national candidate. Instead, the Whigs nominated several regional candidates. With multiple candidates, the Whig party hoped to deny Van Buren a majority, and throw the election to House of Representatives.
In the 1836 campaign, the issue of slavery became important for the first time. Van Buren attempted to keep both the South and North happy. He claimed Congress had the right to outlaw slavery in the District of Columbia. Though, he personally opposed such a move. Van Buren's principal opponent was William Henry Harrison. Harrison was a strong supporter of federal money for internal improvements. This gave Harrison strong support in the West. In addition, Harrison promised he would be willing to reopen the Bank of the United States– if economic conditions warranted it. Van Buren maintained Jackson's staunch opposition to the Bank. In the end, the superior organization of the Democrats determined the election in favor of Van Buren. With Democratic support, Van Buren was able to gain more than 50% of the vote.
The Popular Vote
The recorded popular vote in each state.
Figures as recorded by HistoryCentral.