 >
>1856 Election Results Buchanan vs Freemont
The passing of the Kanas Nebraska Act in 1854 brought an end to the Whig party. It also forged the creation of new parties. The act was profoundly divisive. It gave Kansas and Nebraska the right to decide whether or not to allow slavery in their borders. The result was a mini civil war fought in Kansas, between opponents and supporters of slavery. The Whig party had always been divided between Northern opponents of slavery and Southern slavery supporters. As the central divide in the United States became slavery, the Whig party fell apart. This led to the founding of two new parties: the Republican party and the American Party. The Republican party was founded in 1854. The main goal of the Republican party was to stop the expansion of slavery. The American party, otherwise known as the "Know-Nothing" Party, was founded in 1855. The main goal of the American party was to stop immigration.
The Democrats met in Cincinnati in June 1856. President Pierce hoped to be nominated for a second term. That was not going to happen. Instead, the Democrats settled on James Buchanan. His primary appeal was the fact he had been abroad during the previous few years. Buchanan had not been involved in any of the controversy surrounding the Kanas Nebraska Act. Buchanan was nominated unanimously on the 17th ballot. The Democratic platform supported the compromise of 1850, opposed federal interference in slavery, and supported the building of the transcontinental railroad.
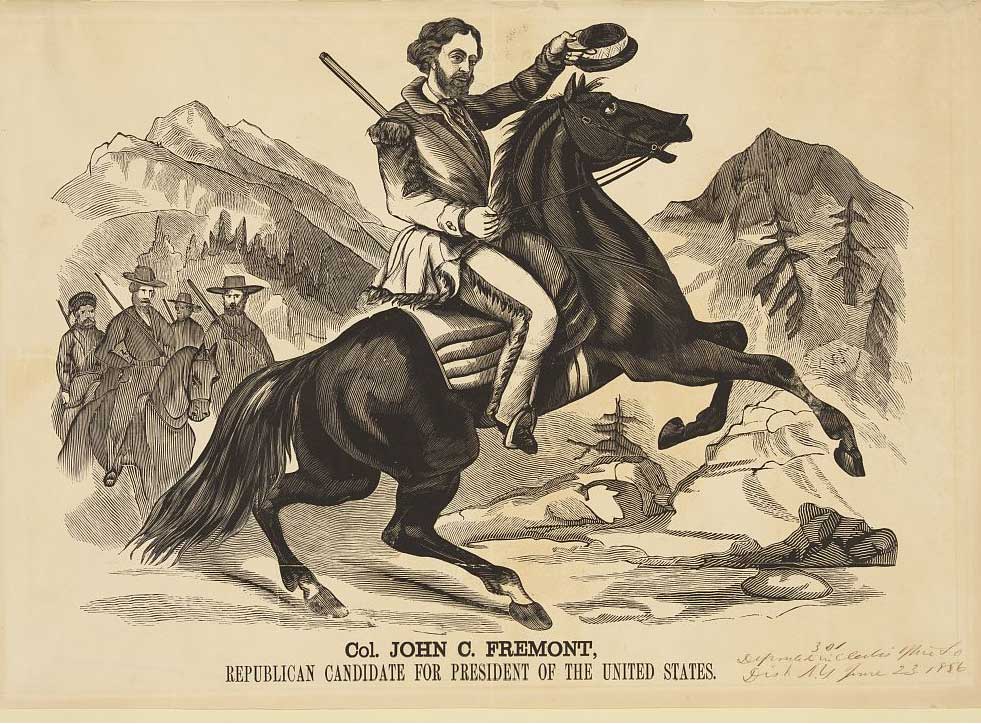
Buchanan had two opponents in the election; John Fremont of the newly organized Republican party, and former President Millard Fillmore of the Know-Nothing Party.
The Republicans opposed the extension of slavery. They held Pierce responsible for the violence in Kansas at the time. The Know-Nothing Party consisted of those opposed to immigration and the Catholic influence they thought it brought. Pierce had a lock on the South, so the fight was over the Northern vote.
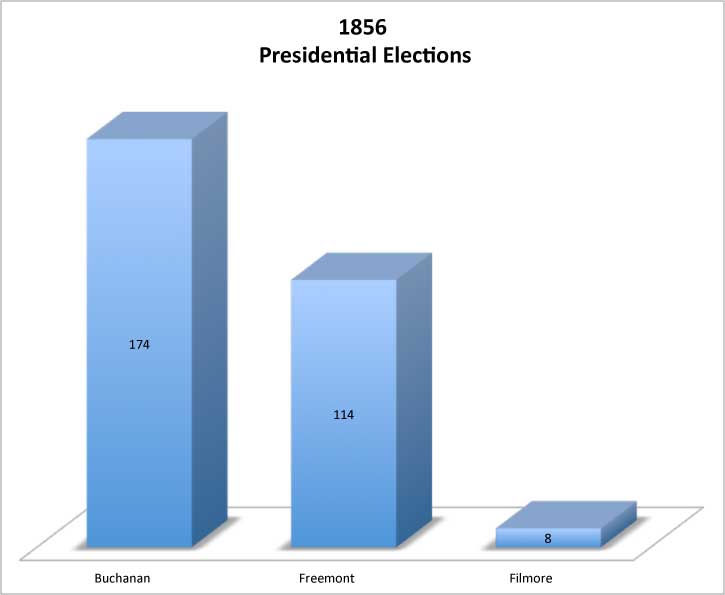
The slogan of the Republican party in the candidate was "Free Speech, Free Press, Free Soil, Free Men, Fremont, and Victory!" The Democrats claimed the South would not stand for a Fremont victory and would secede. In addition, they claimed that Fremont was a Catholic (which he was not, although he was married in a church). That rumor caused Fremont the loss of substantial support. Buchanan narrowly won the election. Fillmore came in third he won 21.6 percent, the highest percentage vote received by a third party in the 19th century.
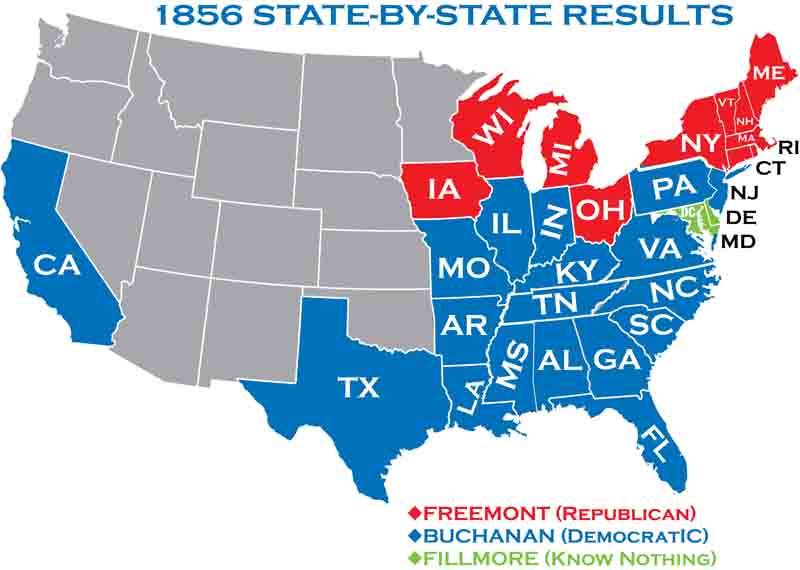
State results in 1856
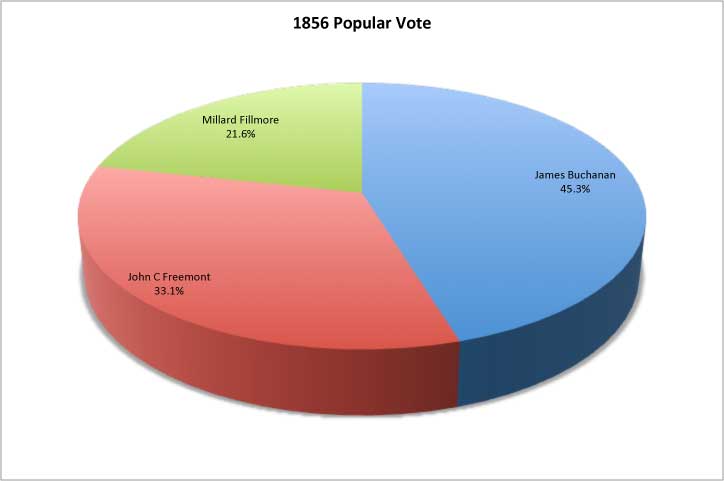
Popular Results in 1856
| Alabama | James Buchanan | 46,739 | 62.1 | John Fremont | 0 | 0 | Millard Fillmore | 28,552 | 37.9 |
| Arkansas | James Buchanan | 21,910 | 67.1 | John Fremont | - | 0 | Millard Fillmore | 10,732 | 32.9 |
| California | James Buchanan | 53,342 | 48.4 | John Fremont | 20,704 | 18.8 | Millard Fillmore | 36,195 | 32.8 |
| Connecticut | James Buchanan | 35,028 | 43.6 | John Fremont | 42,717 | 53.2 | Millard Fillmore | 2,615 | 3.3 |
| Delaware | James Buchanan | 8,004 | 54.8 | John Fremont | 310 | 2.1 | Millard Fillmore | 6,275 | 43.0 |
| Florida | James Buchanan | 6,358 | 56.8 | John Fremont | - | 0 | Millard Fillmore | 4,833 | 43.2 |
| Georgia | James Buchanan | 56,581 | 57.1 | John Fremont | - | 0 | Millard Fillmore | 42,439 | 42.9 |
| Illinois | James Buchanan | 105,528 | 44.1 | John Fremont | 96,275 | 40.2 | Millard Fillmore | 37,531 | 15.7 |
| Indiana | James Buchanan | 118,670 | 50.4 | John Fremont | 94,375 | 40.1 | Millard Fillmore | 22,356 | 9.5 |
| Iowa | James Buchanan | 37,568 | 40.7 | John Fremont | 45,073 | 48.8 | Millard Fillmore | 9,669 | 10.5 |
| Kentucky | James Buchanan | 74,642 | 52.5 | John Fremont | - | 0 | Millard Fillmore | 67,416 | 47.5 |
| Louisiana | James Buchanan | 22,164 | 51.7 | John Fremont | - | 0 | Millard Fillmore | 20,709 | 48.3 |
| Maine | James Buchanan | 39,140 | 35.7 | John Fremont | 67,279 | 61.3 | Millard Fillmore | 3,270 | 3.0 |
| Maryland | James Buchanan | 39,123 | 45.0 | John Fremont | 285 | 0.3 | Millard Fillmore | 47,452 | 54.6 |
| Massachusetts | James Buchanan | 39,244 | 23.1 | John Fremont | 108,172 | 63.6 | Millard Fillmore | 19,626 | 11.5 |
| Michigan | James Buchanan | 52,136 | 41.5 | John Fremont | 71,762 | 57.2 | Millard Fillmore | 1,660 | 1.3 |
| Mississippi | James Buchanan | 35,456 | 59.4 | John Fremont | - | 0 | Millard Fillmore | 24,191 | 40.6 |
| Missouri | James Buchanan | 57,964 | 54.4 | John Fremont | - | 0 | Millard Fillmore | 48,522 | 45.6 |
| New Hampshire | James Buchanan | 31,891 | 45.7 | John Fremont | 37,473 | 53.7 | Millard Fillmore | 410 | 0.6 |
| New Jersey | James Buchanan | 46,943 | 47.2 | John Fremont | 28,338 | 28.5 | Millard Fillmore | 24,115 | 24.3 |
| New York | James Buchanan | 195,878 | 32.8 | John Fremont | 276,004 | 46.3 | Millard Fillmore | 124,604 | 20.9 |
| North Carolina | James Buchanan | 48,243 | 56.8 | John Fremont | - | 0 | Millard Fillmore | 36,720 | 43.2 |
| Ohio | James Buchanan | 170,874 | 44.2 | John Fremont | 187,497 | 48.5 | Millard Fillmore | 28,121 | 7.3 |
| Pennsylvania | James Buchanan | 230,772 | 50.1 | John Fremont | 147,963 | 32.1 | Millard Fillmore | 82,202 | 17.8 |
| Rhode Island | James Buchanan | 6,680 | 33.7 | John Fremont | 11,467 | 57.8 | Millard Fillmore | 1,675 | 8.5 |
| Tennessee | James Buchanan | 69,704 | 52.2 | John Fremont | - | 0 | Millard Fillmore | 63,878 | 47.8 |
| Texas | James Buchanan | 31,995 | 66.6 | John Fremont | - | 0 | Millard Fillmore | 16,010 | 33.4 |
| Vermont | James Buchanan | 10,569 | 20.9 | John Fremont | 39,561 | 78.1 | Millard Fillmore | 545 | 1.1 |
| Virginia | James Buchanan | 90,083 | 60.0 | John Fremont | - | 0 | Millard Fillmore | 60,150 | 40.0 |
| Wisconsin | James Buchanan | 52,843 | 43.8 | John Fremont | 67,090 | 55.7 | Millard Fillmore | 580 | 0.5 |