1840 Election Results Harrison VS Van Buren

President Van Buren was very unpopular by the time the election of 1840 neared. Van Buren was blamed for the depression that followed the Panic of 1837. President Van Buren was reviled for not doing anything to improve the economy. As a result, the Whig Party felt they had a good chance to capture the White House.
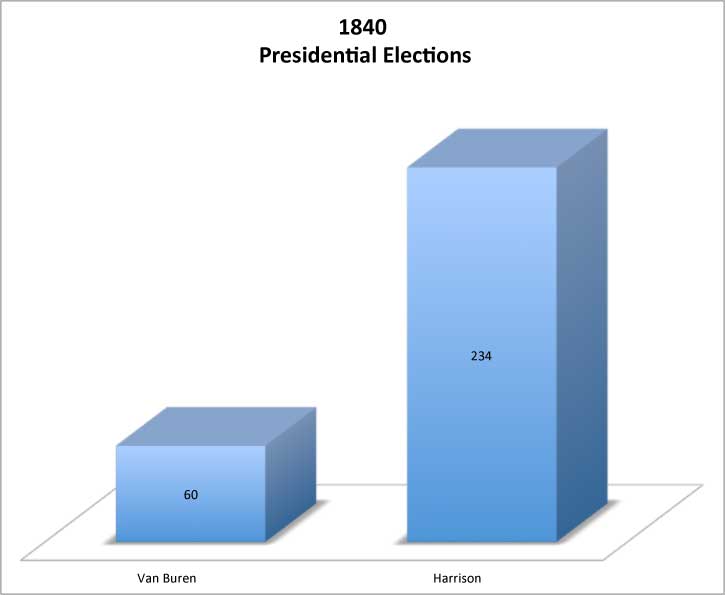
Henry Clay, of Kentucky, was the early favorite at the Whig convention in Harrisburg, Pennsylvania, in December 1839. Clay, however, was a Mason. Strong anti-mason feeling was strong enough to block his nomination. In the final ballot, Harrison was nominated, with 148 votes to Clay's 90, and Scott's 16. John Tyler was nominated as the Vice Presidential candidate. Meanwhile, President Van Buren was unanimously renominated by the Democrats.
The election of 1840 was the first campaign with slogans, songs, and modern campaign paraphernalia. The motto that became best known was: "Tippecanoe and Tyler too." Tippecanoe was the battle Harrison won against the Indians in 1811. Harrison was portrayed as a man of the people. His views on most significant issues were unknown to voters. The economy was the major issue of the campaign. Van Buren shouldered the blame for the poor state of the economy. Harrison promised to get the economy moving again. By this time, Van Buren was so wildly unpopular that he even lost his home state.

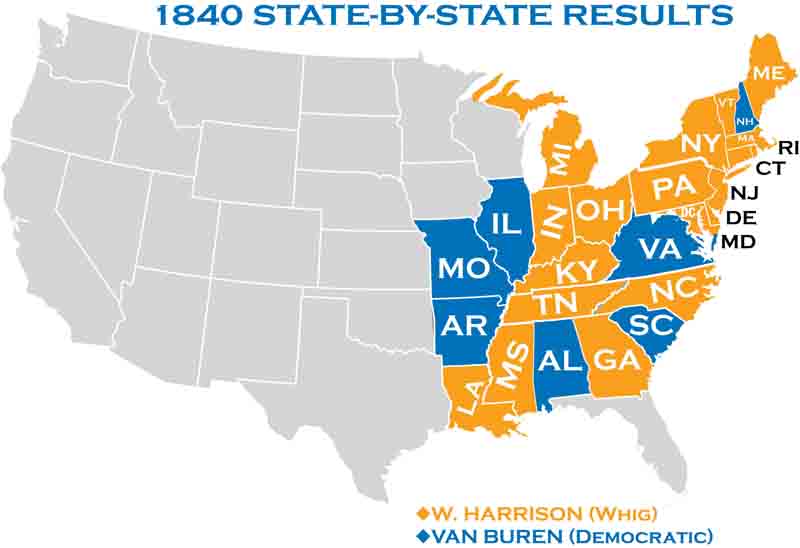
State results in 1840

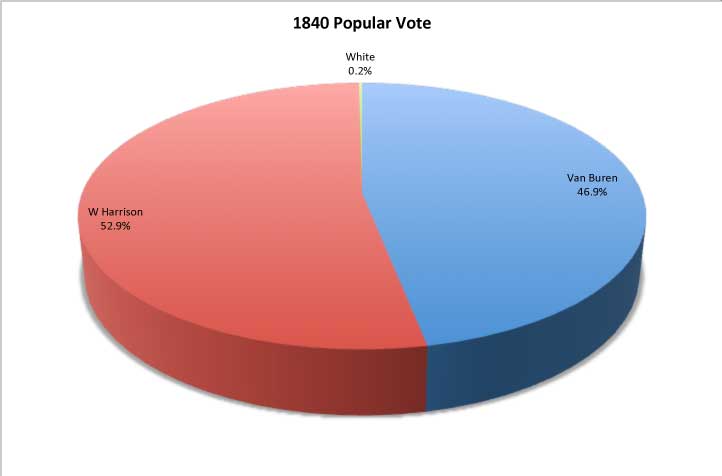
Popular Results in 1840
| W. Harrison | Van Buren | Birney | Total Votes | ||||
| Votes | Pct | Votes | Pct | Vote | Pct | ||
| Alabama | 28,515 | 45.6 | 33,996 | 54.4 | 0 | 62,511 | |
| Arkansas | 5,160 | 43.6 | 6,679 | 56.4 | 0 | 11,839 | |
| Connecticut | 31,598 | 55.6 | 25,281 | 44.4 | 0 | 56,879 | |
| Delaware | 5,967 | 50 | 4,872 | 44.9 | 0 | 10,852 | |
| Georgia | 40,339 | 55.8 | 31,983 | 44.2 | 0 | 72,322 | |
| Illinios | 45,574 | 48.9 | 47,441 | 50.9 | 160 | 0.2 | 93,175 |
| Indiana | 65,280 | 55.5 | 51,696 | 44 | 30 | 0 | 117,605 |
| Kentucky | 58,488 | 64.2 | 32,616 | 35.8 | 0 | 91,104 | |
| Louisiana | 11,296 | 59.7 | 7,616 | 40.3 | 0 | 18,912 | |
| Maine | 46,612 | 50.2 | 46,190 | 49.8 | 0 | 92,802 | |
| Maryland | 33,528 | 53.8 | 28,752 | 46.2 | 0 | 62,280 | |
| Massachusetts | 72,852 | 57.4 | 52,355 | 41.3 | 1,618 | 1.3 | 126,825 |
| Michigan | 22,933 | 52.1 | 21,096 | 47.9 | 0 | 44,029 | |
| Mississippi | 19,515 | 53.4 | 17,010 | 46.6 | 0 | 36,525 | |
| Missouri | 22,954 | 43.4 | 29,969 | 56.6 | 0 | 52,923 | |
| New Hampshire | 26,310 | 43.9 | 32,774 | 54.7 | 872 | 1.5 | 59,956 |
| New Jersey | 33,351 | 51.7 | 31,034 | 48.1 | 69 | 0.1 | 64,454 |
| New York | 226,001 | 51.2 | 212,733 | 48.2 | 2,809 | 0.6 | 441,543 |
| North Carolina | 46,567 | 57.7 | 34,168 | 42.3 | 0 | 0 | 80,735 |
| Ohio | 148,043 | 54.3 | 123,944 | 45.4 | 903 | 0.3 | 272,890 |
| Pennsylvania | 144,023 | 50.1 | 143,672 | 49.9 | 0 | 0 | 287,695 |
| Rhode Island | 5,213 | 60.4 | 3,263 | 37.8 | 19 | 0.2 | 8,631 |
| Tennessee | 60,194 | 55.7 | 47,951 | 44.3 | 0 | 0 | 108,145 |
| Vermont | 32,440 | 63.9 | 18,006 | 35.5 | 317 | 0.6 | 50,782 |
| Virginia | 42,637 | 49.4 | 43,757 | 50.6 | 0 | 0 | 86,394 |
 >
>